Marking The State of Water Stewardship in an AI Driven Era
The world is experiencing increased demands on energy and water use, primarily driven by transformative technologies such as AI as well as extreme weather events and an evolving economy.
- By 2030, it is estimated that AI-related growth will demand additional power equivalent to the annual needs of India1 and as much water to meet the annual drinking water needs of the United States2.
- Data centers could use more than 1 trillion gallons of fresh water annually by 20273.
- There is a projected 56% gap between freshwater supply and demand by 20304 and the demand for water is projected to increase by up to 30% by 20505.
As a global sustainability leader, Ecolab is helping solve these water challenges. Our 2025 study provides insights into the latest water perceptions and concerns, guiding businesses, governments and nonprofits to develop effective water strategies. Understanding public perception is essential to help inform these strategies and advance towards a water-secure future.
Key Findings From The 2025 Ecolab Watermark Study
Water: The Hidden Cost and Opportunity of AI
While many consumers recognize AI’s substantial power consumption, fewer are aware of its significant water footprint. This awareness gap is particularly notable in Asia Pacific, IMEA, and Latin America.
Consumers’ perceptions of the extent to which each resource is currently used to support AI operations:

China
81% Power
77% Water

IMEA
78% Power
61% Water

Latin America
68% Power
51% Water

Asia Pacific
60% Power
43% Water

Europe
59% Power
46% Water
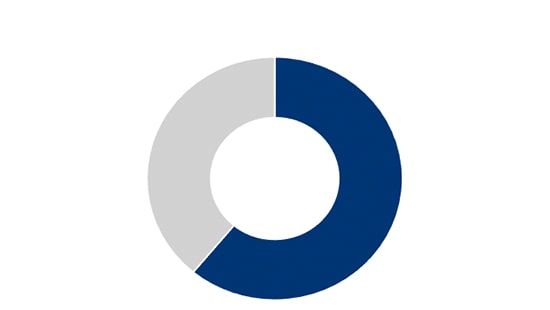
United States
55% Power
46% Water
Data illustrates agreement percentages:
Businesses should leverage AI
for responsible natural resource use
Trust in businesses to manage the power demands of AI operations responsibly
IMEA
2026
76%
63%
China
2026
72%
77%
Latin America
70%
49%
Europe
2026
54%
37%
Asia Pacific
51%
37%
United States
49%
39%

Smart Water Management: Consumers Want Businesses to Reuse Water Smartly
Despite a widespread consumer belief that businesses should prioritize smart water management to address water scarcity, fewer people feel these companies are successfully putting water reuse solutions into practice.
Percent of consumers who believe businesses are reducing, reusing, recycling, restoring and recovering water throughout their daily operations.
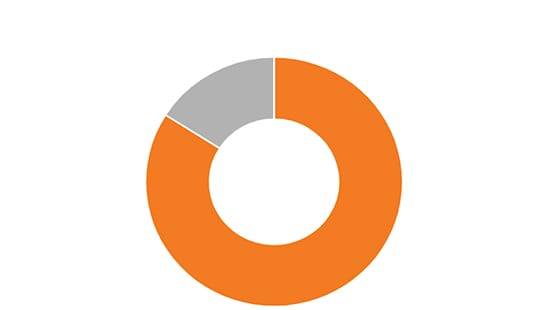
United States
43%
Europe
44%
Latin America
48%
Asia Pacific
48%
IMEA
67%
China
74%
A widespread consensus exists among consumers globally:
Businesses must prioritize investments in technologies and infrastructure to bolster water resource resilience.
to protect water resources from climate change:
Latin America
84%
85%
IMEA
2026
82%
82%
China
2026
77%
76%
Europe
2026
72%
71%
Asia Pacific
71%
70%
United States
68%
67%
Businesses demonstrating responsible water practices can expect strong consumer interest.
Percentage of consumers willing to
actively seek out more information
from these companies:

Latin America
82%

IMEA
2026
78%

China
2026
68%

Asia Pacific
61%

Europe
2026
61%
United States
61%
Water Partnerships
No single entity can tackle water challenges on its own. By forging powerful partnerships, businesses, governments and communities can accelerate coordinated action to unlock solutions and build a water-resilient future for all.
Across most regions, consumers hold businesses (including manufacturers) and governments similarly accountable for water conservation. However, both still face criticism for not contributing enough compared to individuals, non-profits and conservation organizations.
The data below details consumer perceptions of how much each entity has done to date to conserve water in their country:
Latin America
42% Businesses
55% Individuals
48% Government
60% Non-profits
Europe
2026
45% Businesses
56% Individuals
45% Government
54% Non-profits
United States
47% Businesses
58% Individuals
48% Government
56% Non-profits
Asia Pacific
2026
48% Businesses
49% Individuals
46% Government
50% Non-profits
IMEA
2026
63% Businesses
69% Individuals
79% Government
67% Non-profits
China
2026
80% Businesses
79% Individuals
84% Government
79% Non-profits
Despite global water challenges, consumers exhibit significant optimism about our ability to tackle them.
A resounding majority – over 60% of consumers in every region – believe that water scarcity
can be effectively addressed.
The extent to which consumers
agree that water scarcity
can be effectively addressed:
Latin America
84%

IMEA
2026
83%

China
2026
73%

United States
67%

Europe
2026
66%

Asia Pacific
61%
Extreme Weather Events
Consumers perceive that changes in weather and the increase in natural disasters exacerbate water stress,
leading to challenges in both water availability and quality.
Percentage of consumers who are connecting climate change to worsening water stress:

IMEA
2026
81%

China
2026
80%

Latin America
79%

Asia Pacific
2026
69%

Europe
2026
69%

United States
65%
Consumers clearly demand action on climate change, placing a strong expectation
on both corporate and governmental leadership.
Percentages of consumers who consider
it highly important for governments and businesses to prioritize efforts to lessen
the impact of climate change:
Latin America
87%
88%
IMEA
2026
81%
81%
China
2026
76%
77%
Europe
2026
71%
71%
Asia Pacific
70%
69%
United States
67%
67%
Notable Annual Trends
As access to clean and safe water continues to be a critical global issue, consumer concern levels are noteworthy.
How concerned consumers are about clean and safe water, broken down by region:

China
2026
96%

Latin America
92%

United States

Europe
2026
69%

IMEA
2026
67%

Asia Pacific
2026
63%
Consumers across most regions consistently identify Agriculture and
Food & Beverage manufacturing as the industries most responsible for water use.
Agricultural
Food & Beverage
IMEA
2026
52%
37%
Latin America
48%
44%
Asia Pacific
47%
36%
Europe
2026
47%
33%
United States
43%
31%
China
2026
29%
28%
Advancing Water Stewardship
For over 100 years, Ecolab has worked to protect the resources vital to life by prioritizing water stewardship in our own operations and those of our customers. Across more than 40 industries worldwide, Ecolab helps businesses respond to climate and water challenges by minimizing their water use in critical processes. We help our customers drive lasting impact and achieve an exponential return on investment (eROI) by aligning climate, water, and business growth goals.
Our Solutions
With more than one trillion gallons of water managed annually, Ecolab combines Connected Chemistry™
with digital insights and industry expertise to drive sustainability and growth in tandem.
Learn more about how Ecolab can help you take a smart water management approach in your operations.
Identify Opportunities with the Smart Water Navigator

Take an Enterprise Approach with Ecolab Water for Climate™
Manage Water Performance with 3D TRASAR™ Technology

Visualize Insights with ECOLAB3D™ Digital Services
Our Projects
When you address water resiliency, business can thrive. The following case studies highlight how Ecolab helps deliver a positive impact on our customers’ business, water and climate goals:
Our Partnerships
Our partnerships with leading nongovernmental organizations (NGOs) strengthen our understanding and ability to impact global challenges facing our business, customers and communities. They include:
- Bloomberg Law, “AI Computing on Pace to Consume More Energy Than India, Arm Says,” April 2024: news.bloomberglaw.com/artificial-intelligence/ai-computing-on-pace-to-consume-more-energy-than-india-arm-says↵
- Ecolab analysis of data from Lei, N., & Masanet, E. (2022) and Goldman Sachs (2024)↵
- Making AI Less “Thirsty”: Uncovering and Addressing the Secret Water Footprint of AI Models: www.goldmansachs.com/insights/articles/AI-poised-to-drive-160-increase-in-power-demand and TIME, “How AI Is Fueling a Boom in Data Centers and Energy Demand”: time.com/6987773/ai-data-centers-energy-usage-climate-change/↵
- World Resource Institute: “Setting Enterprise Targets: Modeling Downstream Water Use and Consumption”: Setting Enterprise Targets: Modeling Downstream Water Use and Consumption | World Resource Institute↵
- World Resource Institute, “Securing Freshwater for All”: www.wri.org/freshwater↵